
Data study · Oct 27, 2026
Since 2019, a resold sneaker pays half as much and takes seven times longer to sell
RestocksAIO studied recorded resale sales in RestocksAIO data from 2019 to Oct 26, 2026, StockX sale prices of the same styles from January 2021 to April 2026, and the lowest Alias ask of 42,582 sneaker styles on Oct 26, 2026. RestocksAIO has 8,000+ resellers and 275 million EUR in sales volume. Every customer figure on this page is a share, a median or an index, and each comes from 10 or more sellers. If you buy pairs to resell, the data shows what a pair pays now, how long you hold it and which brands carry the volume.
What we found
Nike and Jordan made 85.5 % of recorded resale sales in the first quarter of 2021. By the second quarter of 2024 they made 37.7 %. No single brand took their place. adidas shoes other than Yeezy, led by the Campus and the Spezial, peaked at 29.5 % in that same quarter. ASICS, carried by the Gel-1130, peaked at 25.9 % in the third quarter of 2025. Nike came back to 41 % of sales in 2026, on slides and the Air Force 1 rather than on one hype model.
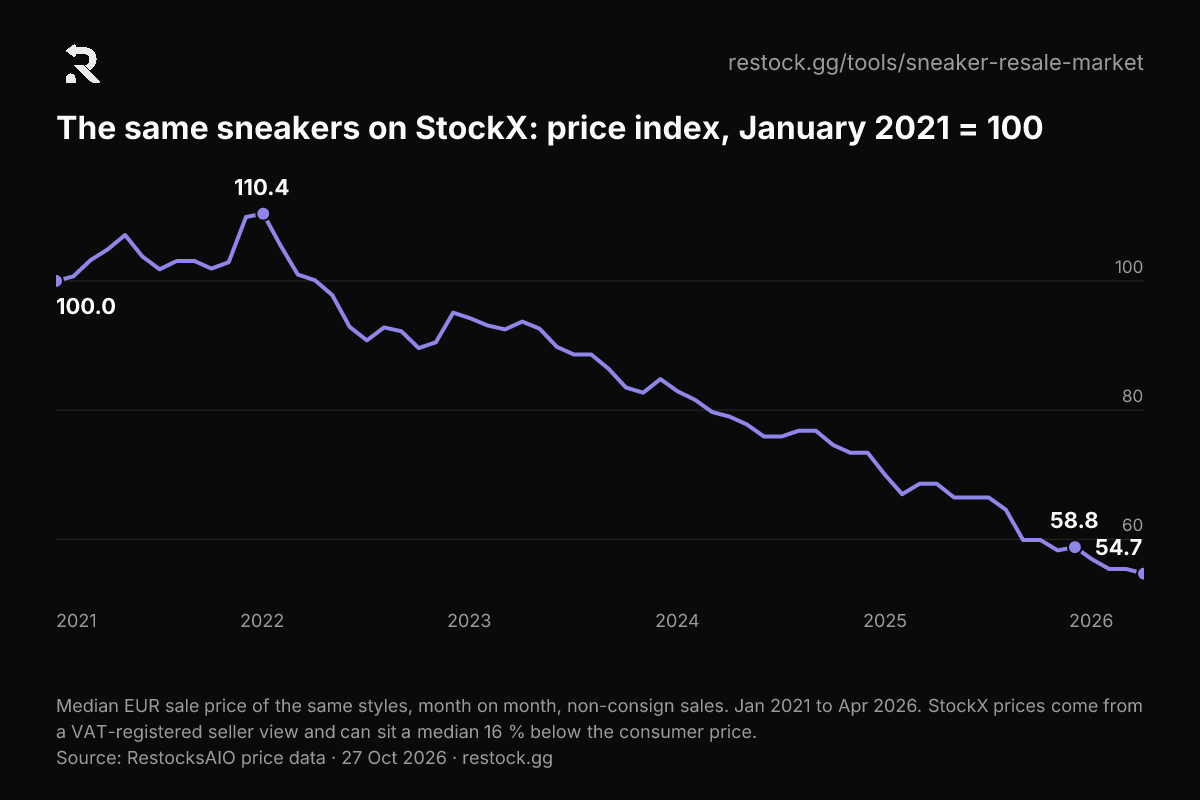
The typical pair pays half of what it paid. The median payout fell from 208 EUR in 2019 to 101 EUR in 2025. Two forces drove the fall. Sellers moved from limited releases to general releases and kids' sizes, which cost less. And the same shoe lost value: on StockX, the price of the same styles fell 41 % from January 2021 to December 2025.
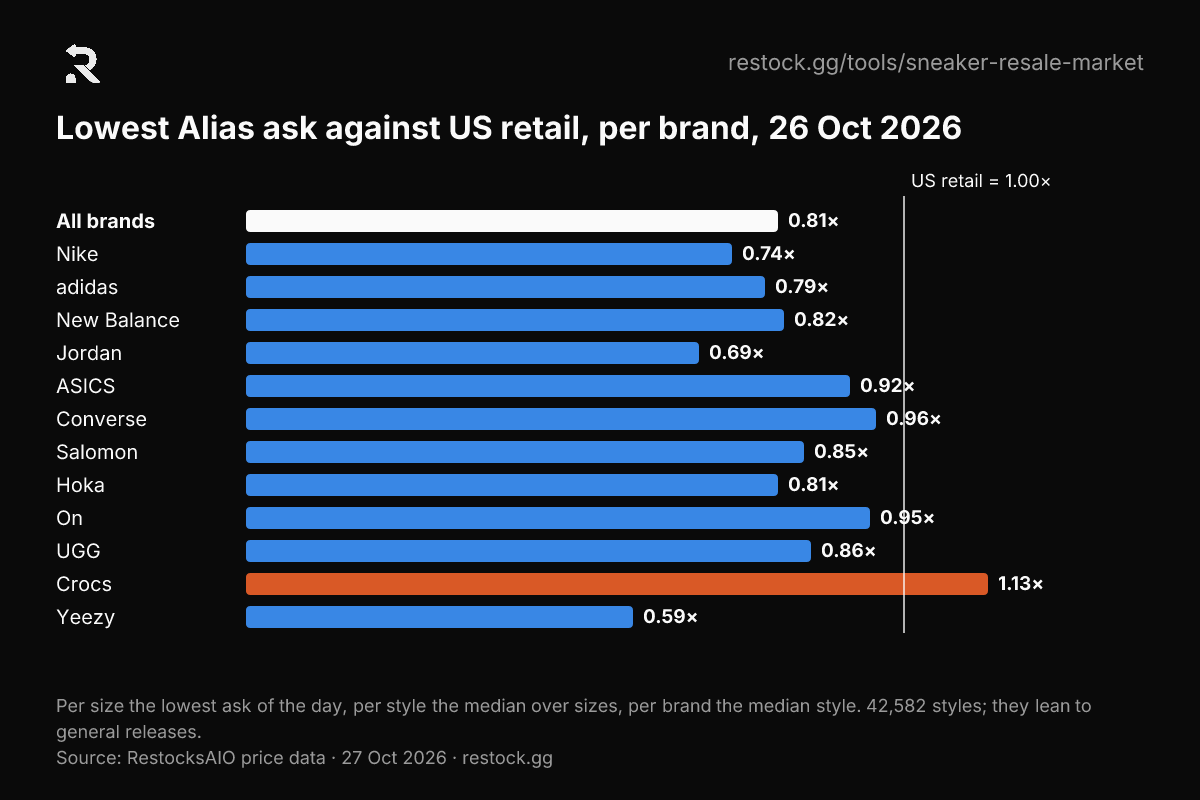
Retail is now a ceiling for most pairs, not a floor. On sales paid in USD, 12 % of pairs paid the seller less than the shoe's US retail price in 2019. In 2025, 58 % did. On Oct 26, 2026, the lowest Alias ask sat under US retail for 68 % of 42,582 tracked styles. Crocs was the only brand whose median style asked more than retail.
The quick flip ended. In 2019 a pair sold a median 56 days after its release date. In 2025 the median was 397 days. Shoes released in the same year made 69 % of sales in 2020 and 21 % in 2025, and almost one pair in four sold more than two years after its release. Sellers now earn on stock they hold, not on stock they turn in the release week.
Each best-seller fades within two years. The Nike Dunk Low made 31 % of sales in 2023 and 6 % in 2025. The Jordan 1 Mid fell from 33 % in 2020 to 12 % in 2022. On StockX, the median style among the 200 most traded of 2023 to 2025 fell under a quarter of its peak monthly sales within 9 months.
Recorded sales peaked in 2022. In 2025 they were 13.6 % of that peak, and the typical seller who kept selling sold 52 % fewer pairs than in 2024. This index follows RestocksAIO sellers, so it tracks our customer base as well as the market. The shares and medians above depend much less on the number of sellers.
Brands: Nike and Jordan lost their majority
The brand mix turned twice. Jordan led in 2020, when the Jordan 1 Mid alone made a third of sales. Nike led from 2021 to 2023 on the Dunk Low. From the end of 2023, adidas terrace shoes and then ASICS took the sales that Nike and Jordan lost. Salomon, On and Hoka stayed under 1 % of sales in every year: ASICS was the running brand that broke through.
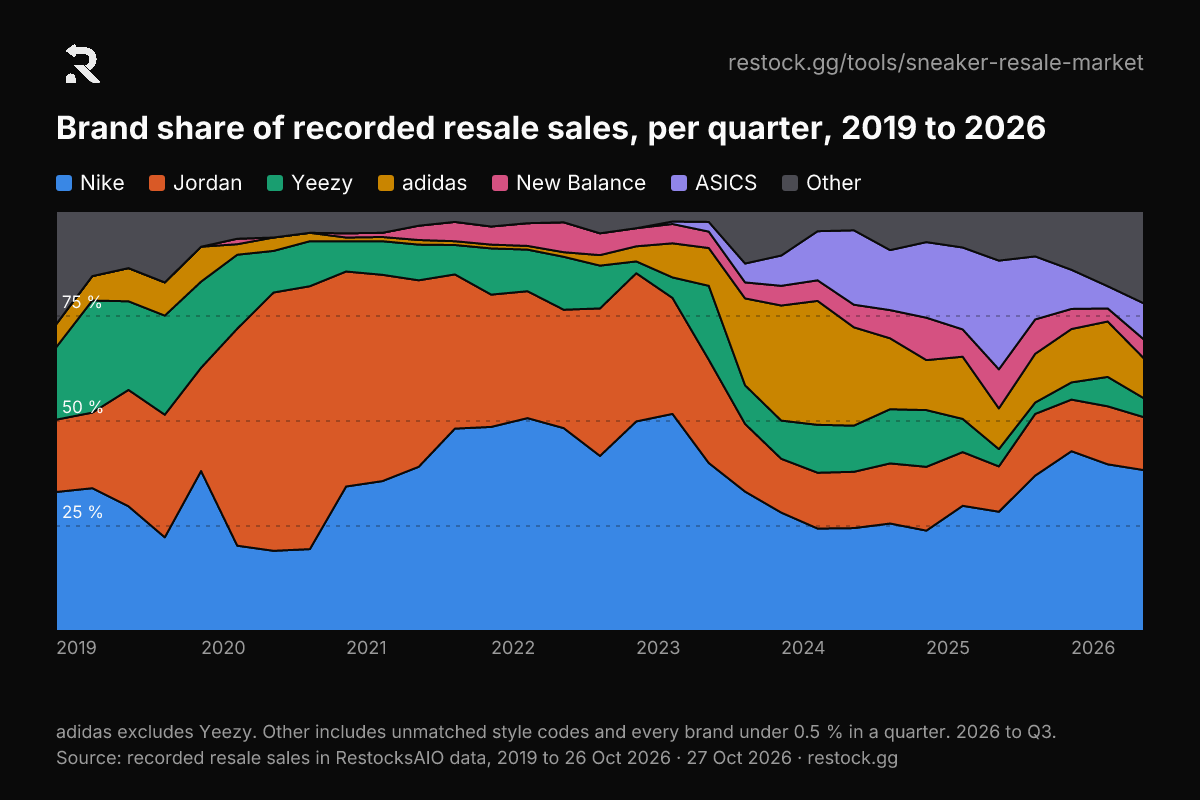
The table gives each brand's share of a year's sales.
| Year | Nike | Jordan | Yeezy | adidas | New Balance | ASICS | Other |
|---|---|---|---|---|---|---|---|
| 2019 | 27.4 % | 25.3 % | 22.9 % | 7.2 % | – | – | 17.2 % |
| 2020 | 21.5 % | 56.0 % | 13.0 % | 3.1 % | 0.5 % | – | 5.9 % |
| 2021 | 41.6 % | 43.0 % | 7.6 % | 1.0 % | 3.2 % | – | 3.6 % |
| 2022 | 46.5 % | 31.6 % | 10.9 % | 1.6 % | 5.7 % | – | 3.7 % |
| 2023 | 44.7 % | 27.1 % | 8.0 % | 9.4 % | 4.2 % | 1.6 % | 5.0 % |
| 2024 | 25.9 % | 13.4 % | 10.9 % | 24.5 % | 5.4 % | 12.2 % | 7.7 % |
| 2025 | 28.2 % | 13.6 % | 8.6 % | 12.2 % | 8.6 % | 19.6 % | 9.2 % |
| 2026, to Oct 26 | 41.0 % | 12.8 % | 5.1 % | 12.1 % | 4.0 % | 7.6 % | 17.4 % |
–: under 0.5 % or fewer than 10 sellers, counted in Other. adidas excludes Yeezy. Other includes sales whose style code matches no product.
Prices: retail became the ceiling
The left panel shows the median payout of a pair on EUR sales. The right panel shows the share of USD sales that paid the seller less than the US retail price of the same shoe. Payout is after marketplace fees, so a payout under retail is not always a loss: a seller who bought at a discount can still make money.
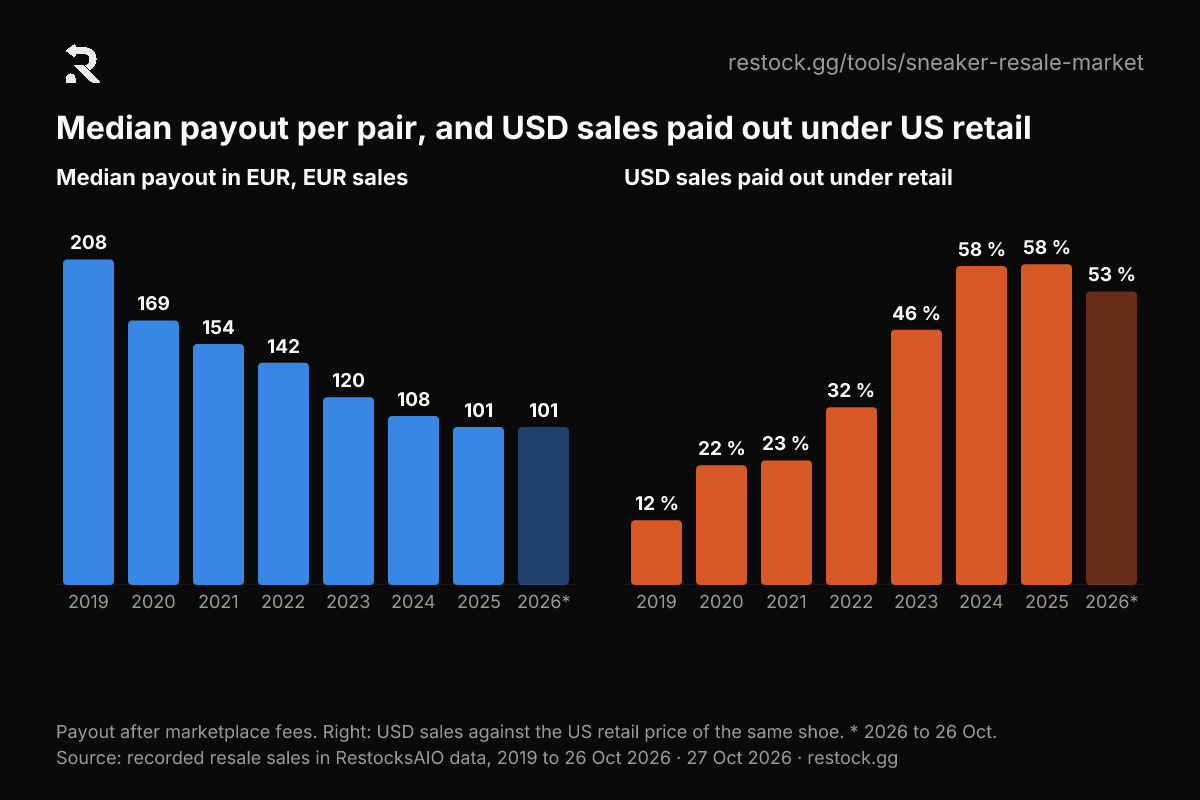
Part of the fall in the median is a change of mix: more general releases and kids' sizes. The price index removes the mix. Each month it compares the median price of the same styles with the month before. The same sneakers sold for 41 % less on StockX in December 2025 than in January 2021. The index peaked at 110.4 in January 2022 and was at 54.7 in April 2026.
Asks tell the same story from the listing side. On Oct 26, 2026, the median style asked 0.81× of its US retail price on Alias. Yeezy (0.59×) and Jordan (0.69×) asked the least against retail. Crocs (1.13×) was the only brand above retail, and Converse (0.96×), On (0.95×) and ASICS (0.92×) came closest.
The table gives the payout of a pair per year.
| Year | Median payout, EUR sales | Payout / US retail, USD sales | USD sales paid out under retail |
|---|---|---|---|
| 2019 | 208 EUR | 1.35× | 11.7 % |
| 2020 | 169 EUR | 1.27× | 21.6 % |
| 2021 | 154 EUR | 1.35× | 22.5 % |
| 2022 | 142 EUR | 1.13× | 32.1 % |
| 2023 | 120 EUR | 1.03× | 46.1 % |
| 2024 | 108 EUR | 0.96× | 57.6 % |
| 2025 | 101 EUR | 0.94× | 57.9 % |
| 2026, to Oct 26 | 101 EUR | 0.98× | 53.0 % |
The table gives the asks of Oct 26, 2026 per brand.
| Brand | Styles | Median ask / retail | Styles under retail | Styles at 1.5× retail or more |
|---|---|---|---|---|
| All brands | 42,582 | 0.81× | 68.1 % | 8.4 % |
| Nike | 12,846 | 0.74× | 72.9 % | 6.9 % |
| adidas | 8,582 | 0.79× | 71.1 % | 7.7 % |
| New Balance | 2,916 | 0.82× | 69.9 % | 4.7 % |
| Jordan | 2,622 | 0.69× | 79.6 % | 5.6 % |
| ASICS | 1,680 | 0.92× | 58.1 % | 13.6 % |
| Converse | 1,318 | 0.96× | 53.5 % | 14.5 % |
| Salomon | 779 | 0.85× | 70.2 % | 7.1 % |
| Hoka | 607 | 0.81× | 71.8 % | 5.4 % |
| On | 596 | 0.95× | 55.9 % | 10.4 % |
| UGG | 461 | 0.86× | 63.8 % | 8.5 % |
| Crocs | 355 | 1.13× | 38.9 % | 18.0 % |
| Yeezy | 75 | 0.59× | 81.3 % | 2.7 % |
The tracked styles lean to general releases and outlet stock. An ask is a list price, not a sale.
Time: from eight weeks to more than a year
The median time from release date to sale grew in every year from 2020. By brand in 2025, Jordan sold fastest at a median 130 days, then Nike at 299, adidas at 344 and ASICS at 558 days. Sales before the release date fell from 6 % to 11 % of sales in 2018 to 2022 to under 2 % from 2024. For a long-running model such as the Gel-1130 or the Samba, the catalogue date can be the date of the first colourway, which makes the wait look longer.
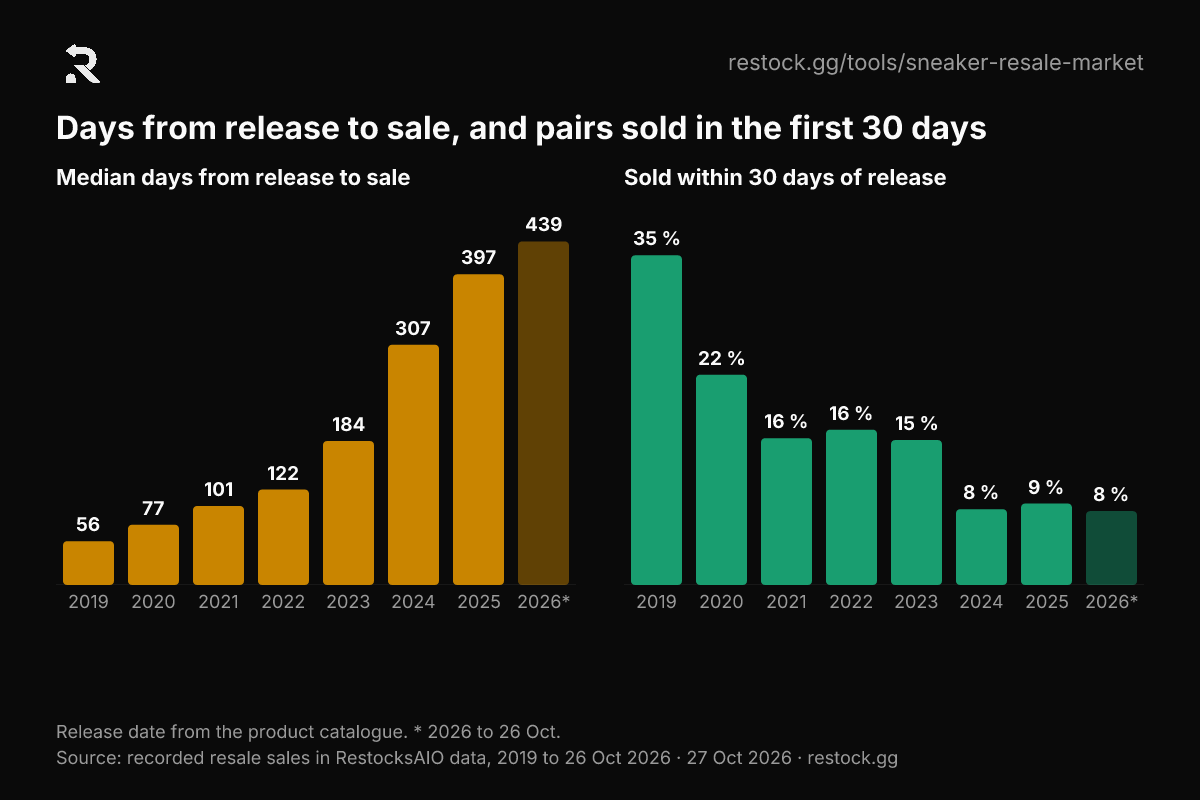
The table gives the timing of a sale per year.
| Year | Median days from release to sale | Sold within 30 days | Sold 2+ years after release | Released in the same year |
|---|---|---|---|---|
| 2019 | 56 | 34.8 % | 4.2 % | 64 % |
| 2020 | 77 | 22.2 % | 3.1 % | 69 % |
| 2021 | 101 | 15.5 % | 3.7 % | 50 % |
| 2022 | 122 | 16.4 % | 5.3 % | 49 % |
| 2023 | 184 | 15.3 % | 16.5 % | 37 % |
| 2024 | 307 | 8.0 % | 18.1 % | 29 % |
| 2025 | 397 | 8.6 % | 23.9 % | 21 % |
| 2026, to Oct 26 | 439 | 7.8 % | 35.7 % | 17 % |
11 to 27 % of sales per year have no release date. They are not in these figures.
Best-sellers: each one fades within two years
Each year had a different number one: the Yeezy 350 V2 in 2019, the Jordan 1 Mid in 2020 and 2021, the Dunk Low from 2022 to 2024, the ASICS Gel-1130 in 2025 and, so far in 2026, the Nike Mind 001 and 002. None held its share. The adidas Campus went from 7.5 % of sales in 2024 to 0.9 % in 2025. Kids' sizes carried each wave: in 2023 the Dunk Low Panda in grade-school sizes was the best-selling product.
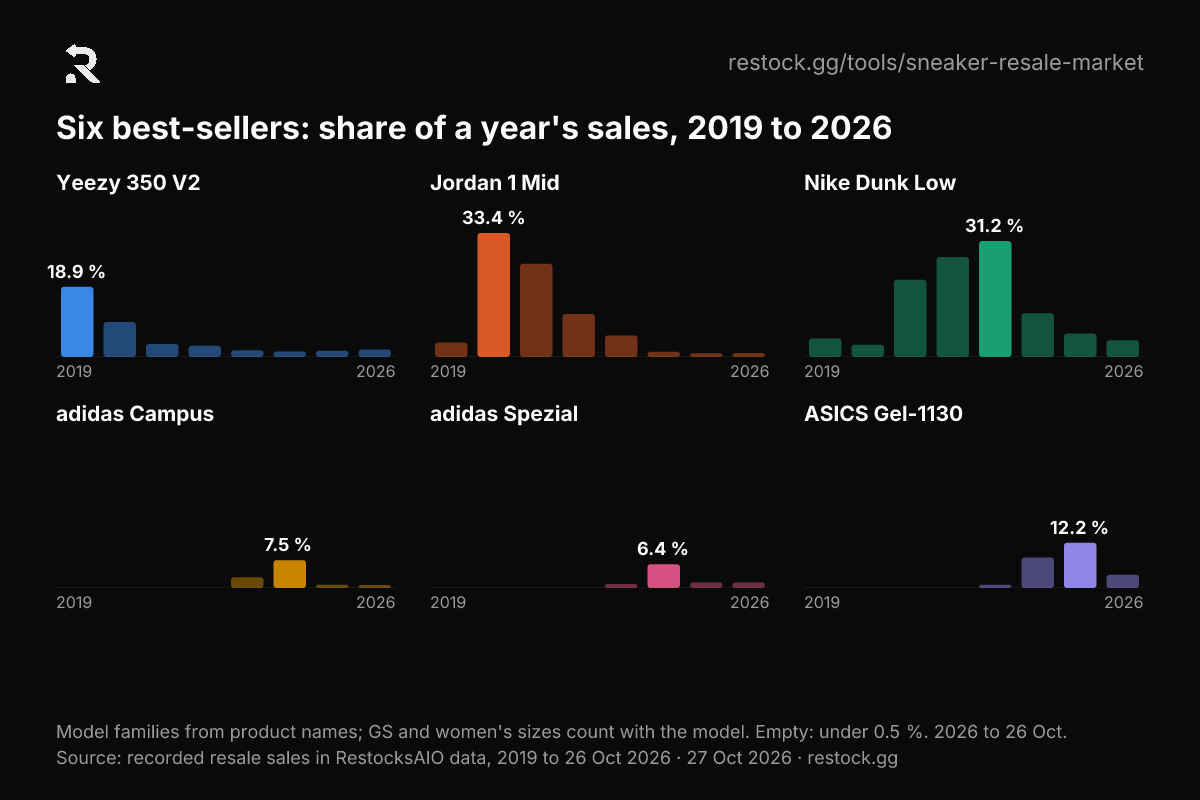
The table gives each best-seller's peak and its share two years later.
| Model | Peak year | Share at the peak | Two years later |
|---|---|---|---|
| Yeezy 350 V2 | 2019 | 18.9 % | 3.5 % (2021) |
| Jordan 1 Mid | 2020 | 33.4 % | 11.6 % (2022) |
| Nike Dunk Low | 2023 | 31.2 % | 6.3 % (2025) |
| adidas Campus | 2024 | 7.5 % | 0.8 % (2026, to Oct 26) |
| adidas Spezial | 2024 | 6.4 % | 1.5 % (2026, to Oct 26) |
| ASICS Gel-1130 | 2025 | 12.2 % | 3.6 % (2026, to Oct 26) |
Volume: the 2022 peak, and what this index measures
Recorded sales grew in every year to 2022, then fell. 2023 was at 85.9 % of the peak, 2024 at 36.2 % and 2025 at 13.6 %. From 1 January to 26 October 2026, sales were 20.5 % of the same days in 2025.
Read this index with care. It counts the sales of RestocksAIO sellers, so it rose as sellers joined until 2022 and fell as sellers left from 2023. It tracks our customer base as well as the market. The same-seller panel corrects part of that: sellers with 20 or more sales in both years sold a median 37.5 % fewer pairs in 2023, 37.5 % fewer in 2024 and 52.3 % fewer in 2025. Those sellers stayed, so the panel shows the market at its best.
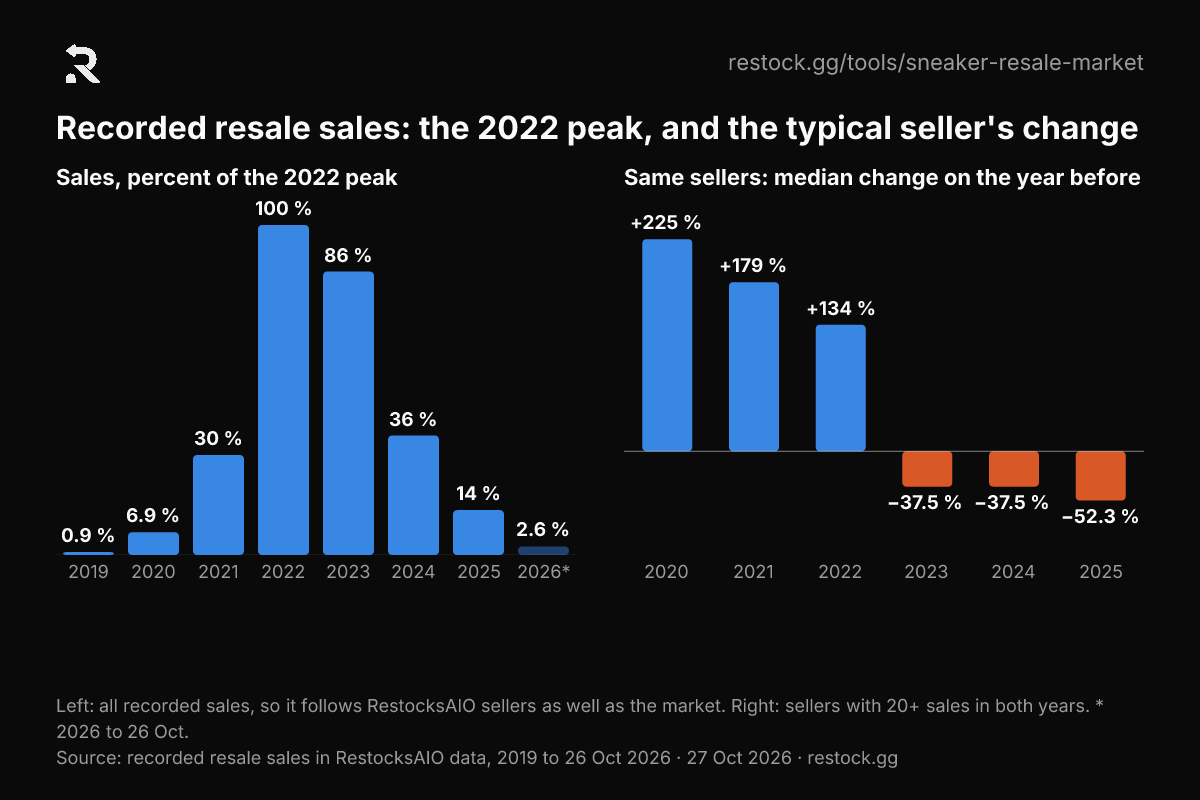
The table gives the volume index per year.
| Year | Sales, percentage of the 2022 peak | Same sellers: median change on the year before |
|---|---|---|
| 2019 | 0.9 % | – |
| 2020 | 6.9 % | +225.0 % |
| 2021 | 30.3 % | +179.4 % |
| 2022 | 100.0 % | +134.3 % |
| 2023 | 85.9 % | −37.5 % |
| 2024 | 36.2 % | −37.5 % |
| 2025 | 13.6 % | −52.3 % |
| 2026, to Oct 26 | 2.6 % | – |
–: fewer than 10 sellers in the panel, or a partial year.
Marketplaces: StockX took the volume and consignment faded
StockX carried 28.1 % of recorded resale sales in 2022 and 57.7 % in 2025. Alias peaked at 42 % in 2023 and 2024. Consignment, where the marketplace holds the pair until it sells, made 43.1 % of sales in 2021 and 1.8 % in 2025. The consignment marketplaces of 2020 and 2021 are in Other. eBay sales are not in this data, so the chart does not measure eBay.
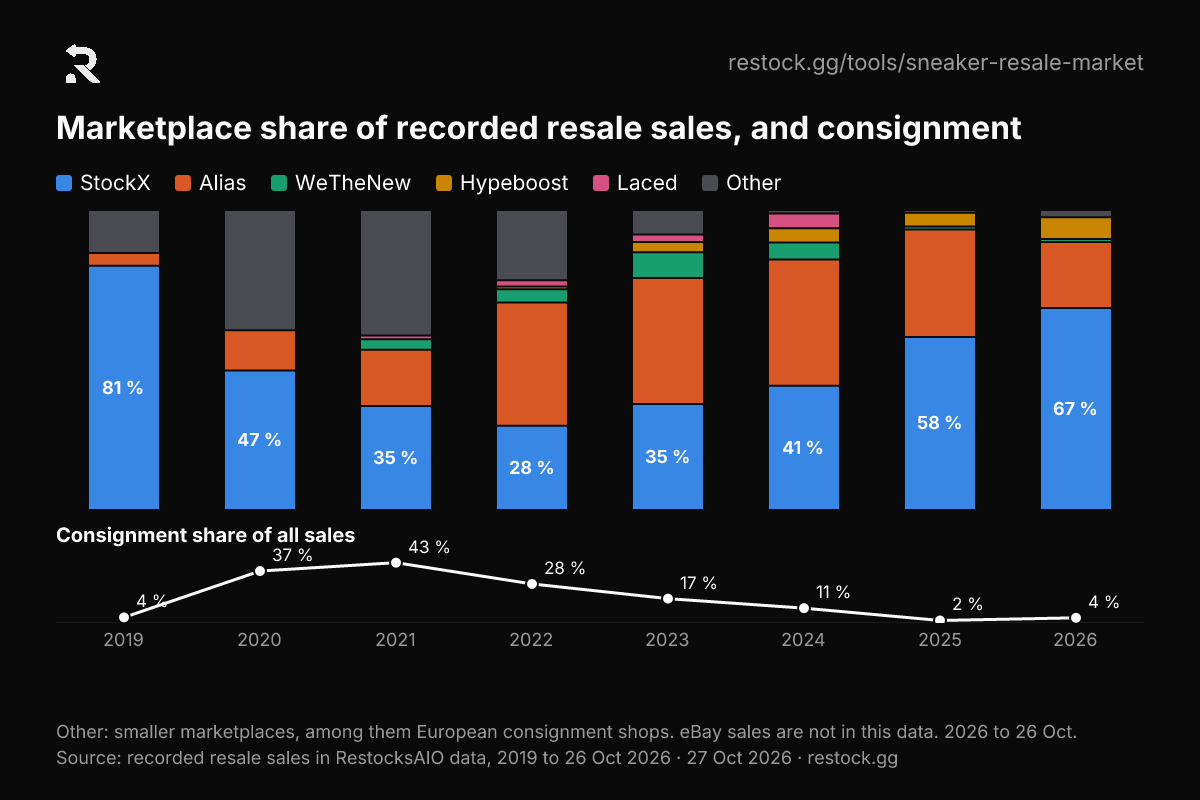
The table gives the marketplace shares per year.
| Year | StockX | Alias | WeTheNew | Hypeboost | Laced | Other | Consignment |
|---|---|---|---|---|---|---|---|
| 2019 | 81.4 % | 4.3 % | – | – | – | 14.3 % | 4.0 % |
| 2020 | 46.5 % | 13.4 % | – | – | – | 40.1 % | 37.1 % |
| 2021 | 34.7 % | 18.7 % | 3.5 % | – | 1.3 % | 41.8 % | 43.1 % |
| 2022 | 28.1 % | 41.1 % | 4.4 % | 0.9 % | 2.1 % | 23.4 % | 27.9 % |
| 2023 | 35.3 % | 42.0 % | 8.6 % | 3.4 % | 2.5 % | 8.2 % | 17.4 % |
| 2024 | 41.4 % | 42.1 % | 5.7 % | 4.7 % | 4.9 % | 1.2 % | 10.6 % |
| 2025 | 57.7 % | 35.8 % | 1.0 % | 4.6 % | 0.8 % | 0.1 % | 1.8 % |
| 2026, to Oct 26 | 67.3 % | 22.0 % | 1.0 % | 7.3 % | – | 2.4 % | 3.7 % |
–: under 0.5 % or fewer than 10 sellers, counted in Other. Consignment counts sales on every marketplace.
Sizes: large sizes pay a little more
A US 13 paid out a median +5.5 % against the median of the same style. A US 9 paid −2.7 %, because more pairs compete in US 8 to 10. adidas sells small: US 5 to 7 made 44 % of adidas sales, against 20 % for Nike and 16 % for Jordan. Terrace shoes sell to women in men's sizes.
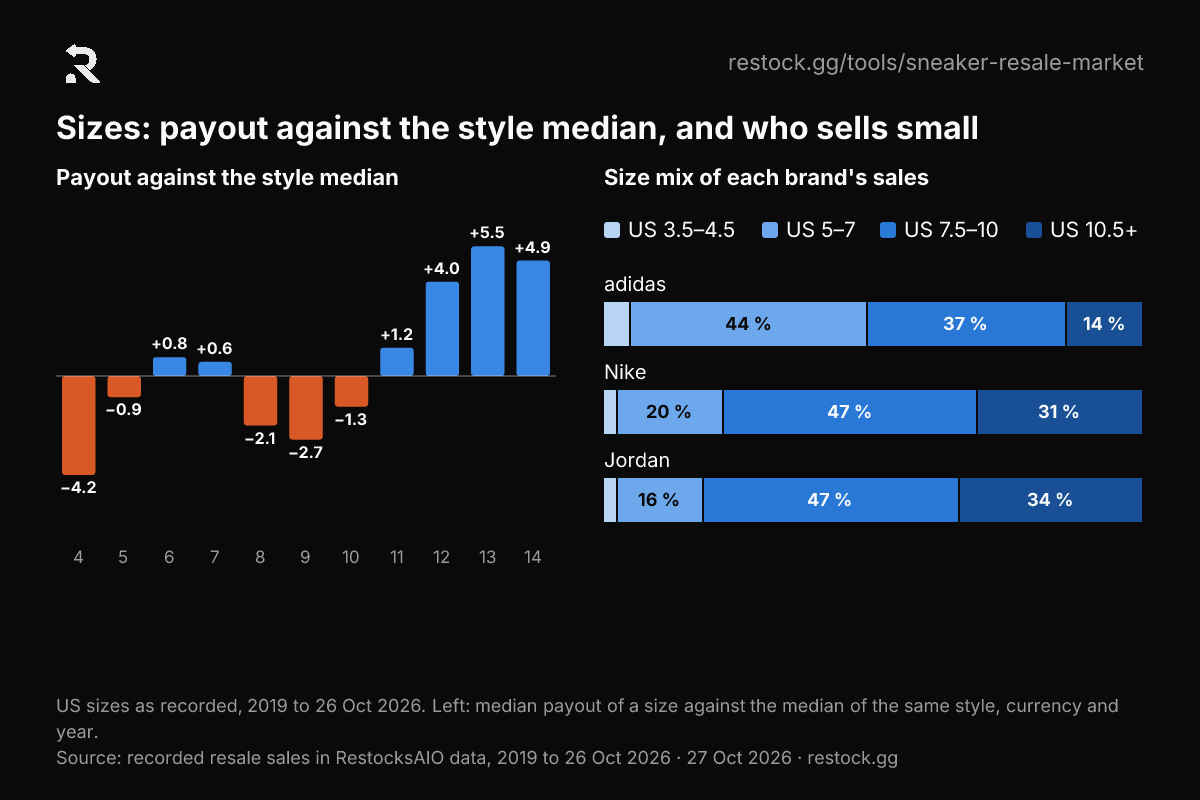
The table gives the share of sales and the payout gap per US size.
| US size | Share of sales | Payout against the style median |
|---|---|---|
| 4 | 1.4 % | −4.2 % |
| 5 | 2.9 % | −0.9 % |
| 6 | 4.7 % | +0.8 % |
| 7 | 6.8 % | +0.6 % |
| 8 | 7.9 % | −2.1 % |
| 9 | 9.0 % | −2.7 % |
| 10 | 9.4 % | −1.3 % |
| 11 | 7.8 % | +1.2 % |
| 12 | 5.2 % | +4.0 % |
| 13 | 2.5 % | +5.5 % |
| 14 | 1.1 % | +4.9 % |
All brands, whole US sizes, 2019 to Oct 26, 2026.
What this means for a seller
Buy for the long hold
A pair now sells a median of more than a year after its release, and fewer than one in ten sells within 30 days. Count the storage and the money tied up in stock when you buy. Do not plan on a release-week flip: sales before the release date are under 2 % of the total.
Buy under retail
Most styles ask under retail, and most USD payouts land under it. Buy under retail, at outlets, in discounts and in bulk lots, or know the payout at your size before you pay retail. Compare the payout after fees, not the ask.
Stock the brands that carry the volume now
In 2025 Nike made 28.2 % of sales, ASICS 19.6 %, Jordan 13.6 %, adidas 12.2 % and New Balance 8.6 %. A best-seller loses most of its share within two years, and a top style loses three quarters of its monthly sales in about 9 months. Do not stock deep on one model at its peak.
Caveats
- The volume index follows RestocksAIO sellers. It tracks our customer base as well as the market. For the market, read the shares, the medians and the same-seller panel.
- The price data has collection breaks. The StockX sale prices are usable from January 2021 to April 2026, and the study does not use May to October 2026. The asks come from one day, Oct 26, 2026. Recorded sales for 2026 run to Oct 26, 2026.
- StockX prices come from a VAT-registered seller view and can sit a median 16 % below the consumer price.
- Retail is the US retail price in a product catalogue. Payout is after marketplace fees, so a payout under retail is not always a loss on the cost of the pair.
- Seller country is unknown. Alias pays out in USD to every seller, so USD sales are not the same as US sellers.
- eBay sales are not in the recorded sales. Brand and model come from the product name, and adidas excludes Yeezy.
Method
Recorded resale sales in RestocksAIO data are the sales that sellers record in RestocksAIO, without admin accounts and without sellers who keep their sales anonymous. Each figure is a share, a median or an index, and each cell has 10 or more sellers. The StockX price index compares the median EUR sale price of the same styles from one month to the next. The asks are the lowest Alias ask per size, with the median over the sizes of each style. Read the full methodology
How to cite
Free for editorial use with a link to RestocksAIO. Suggested credit: “Source: RestocksAIO, How sneaker reselling changed 2019 to 2026, Oct 27, 2026”, with a link to this page.
Download the data (CSV) holds every table on this page, one row per figure. Each chart has its own download link under it.
Cited by
No articles yet.
Tell us at hello@restock.gg when you use the study, and we add your article here.
Questions
Is sneaker reselling still profitable in 2026?
It can be, but not at retail. In 2025 the median payout of a pair was 101 EUR, and 58 % of USD sales paid the seller less than the US retail price. A seller makes money by buying under retail, at outlets, in discounts and in bulk lots, and by holding the pairs that keep their value. ASICS paid out a median 1.03× of retail in 2025, Nike 0.82×.
Which sneaker brands sell best on resale now?
In 2025 Nike made 28.2 % of recorded resale sales in RestocksAIO data, ASICS 19.6 %, Jordan 13.6 %, adidas without Yeezy 12.2 % and New Balance 8.6 %. Crocs is the only brand whose median style asks more than retail (1.13×). Converse (0.96×), On (0.95×) and ASICS (0.92×) come closest.
How long does it take to sell a pair of sneakers?
In 2025 a pair sold a median 397 days after its release date, against 56 days in 2019. Only 8.6 % sold within 30 days of release. Jordan sold fastest at a median 130 days, then Nike at 299, adidas at 344 and ASICS at 558 days.
Can I use these charts and figures in an article?
Yes. The figures, the charts and the CSV are free for editorial use with a link to RestocksAIO. Quote the figure with its date and link to this page or to the methodology. Tell us at hello@restock.gg and we list the article under Cited by.